

(A) Vegetated dune (VD). (B) Bare dune (BD). The different camera angles reveal beach berm and dune apex features, but the initial profiles for VD and BD were equivalent throughout the 104-m length of the flume. (C) VD profile evolution. (D) BD profile evolution. Initial profiles were equivalent at time zero as denoted by dotted lines (shown here only within the vegetated region from 72.5 to 80 m in cross-shore position). Colored lines depict the profiles at the end of the numbered time intervals. (E) Erosion during specified time intervals (bars) and cumulative erosion (lines). (F) Timeline (continuous) of major events in BD versus VD profile evolution. 2,3Refer to Figs. 2 and 3 for details.

(A) VD maximum run-up distance (Rmax), R2% run-up distance, and accretion-erosion patterns over the course of the storm. (B) BD Rmax distance, R2% distance, and accretion-erosion patterns. (C) VD micro-slopes over the course of the storm. (D) BD micro-slopes over the course of the storm. In (D), the white space around 10 and 11.5 hours on the y axis indicates data gaps. Axes for all graphics: The x axis ranges from the time that waves first encountered the vegetation (at 4 hours) until the peak of the storm conditions. The y axis ranges from the cross-shore location where the vegetation began at the dune toe (72.5 m) and extended landward to the dune peak (80 m).
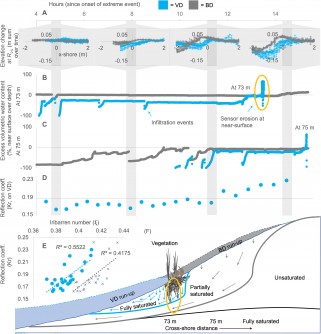
(A) Erosion and accretion at the R2% line at 4.8, 7.9, 11.3, and 14.4 hours into the storm. The x axis for each subgraphic is the cross-shore distance from the R2% line, and the y axis is the summed change per time period. (B and C) Excess volumetric water content across time, near surface at 73 m, and at 75 m in the cross-shore direction, respectively. The x axis is continuous time in hours. Positive values on the y axis refer to near-surface volumetric water content exceeding that at depth, negative values vice versa. (D) Wave reflection across time highlighting the apparent transition at 11.3 hours on VD. (E) Wave reflection for VD and BD as a function of the Iribarren number; VD = 1.4x − 0.4, R2 = 0.42, blue circles; BD = 1.3x − 0.3, R2 = 0.55, black crosses. (F) The vegetation retarded wave run-up and concentrated water volume, supersaturating the sand and promoting instability.

(A) An example of Terrestrial Laser Scanning (TLS) data for the VD profile, viewed from the cross-shore dimension (i.e., the side), at 0, 12.3, 12.8, 13.5, and 14.4 hours into the storm conditions. The red points depict both the vegetation and the sediment surface before the experiment began at 0 hours. The other colors depict the sediment surface only, between 12.3 and 14.4 hours. By 14.4. hours, an initial 0.1-m tall scarp was apparent at ~76.5 m. (B) P. amarum plants on VD before the experiment began at 0 hours. Drip line (black hose) was removed during experimentation. (C) Run-up intercepting plants on VD at 11.3 hours. The depicted sensor array included an optical sediment gauge, sediment movement sensor, ultrasonic sensor, and acoustic velocimeter. (D) A 0.79-m tall scarp on VD at 18.4 hours.
INTRODUCTION
Coastal sand dunes provide the first line of defense from storms for some of the most economically valuable and ecologically important landscapes in the world (1–3). A current and broadly accepted paradigm is that vegetation reduces the erosion of these dunes during wave attack (4–7). The existing body of dune research shows that a greater size (8), density (9–11), and diversity (12) of plants are associated with less erosion, although these studies have been limited to the investigation of relatively small wave events over short time scales (over minutes). Here, we show that during an extreme storm event, vegetation surprisingly accelerates erosion. While vegetation initially creates a physical barrier to wave energy, it also (i) decreases wave run-up, which creates discontinuities in erosion and accretion patterns across the dune slope, (ii) increases water penetration into the sediment bed, which induces destabilization, and (iii) reflects wave energy, which accelerates scarp formation. These findings fundamentally alter our current understanding of how natural features may provide protection during extreme events.
To test the erosion of vegetated dunes (VDs) against bare dunes (BDs) in a controlled laboratory setting, where all other confounding variables could be removed, we constructed 70-m-long × 4.5-m-high beach-dune profiles and subjected them to waves in a 104-m-long flume. The profile geometry, sedimentary characteristics, and hydrodynamics were carefully constructed and monitored to mimic the progression of real storm events over time (Fig. 1, A and B; see Materials and Methods, figs. S1 to S7, and table S1). Panicum amarum, a typical dune plant common to North America, was grown in situ within the flume for 6 months before the experiment. The individual plant characteristics matched those encountered in the field, and the overall plant density and biomass were similar to those found on restored dunes or the lower portions of natural dunes that encountered frequent wave attack (figs. S8 to S10). Once the experiment began, we recorded the real-time evolution of the dune profiles (figs. S4 and S11 to S13) with an array of sensors and at 0.01-m spatial resolution with terrestrial laser scanners (TLSs).
RESULTS
We found that both the VD and bare BD profiles evolved similarly during the early stages of a storm, until the waves first encountered vegetation, 4.0 hours into the event (Fig. 1, C and D). Shortly thereafter, VD formed an initial erosional scarp at 7.9 hours and had faster profile evolution as compared to BD. The vertical scarp was fully formed by 14.4 hours on VD, several hours earlier than on BD at 17.8 hours. By the peak of storm conditions, at 18.4 hours, the VD scarp was farther landward and nearly twice as high as that of BD (0.79 m versus 0.46 m in scarp height).
The final erosional volume, summed up until the peak conditions occurred, was 22% greater for VD compared with BD (Fig. 1, E and F). The cumulative erosion rates of the dunes diverged as the scarp began to form on VD at 7.9 to 14.4 hours, and there was over twice as much erosion on VD as BD by the end of this period (0.65 versus 0.30 m3 per meter alongshore). This difference was briefly narrowed just before 16.0 hours. Then, a second divergence in cumulative erosion rates occurred between 16.0 and 17.8 hours, after a fully vertical scarp was formed in VD and before any scarp formation in BD. However, once the BD scarp formation was underway, at 17.8 hours, the incremental erosional volume and cumulative erosion rates became more similar between VD and BD.
We identified three hydrodynamic mechanisms that led to the erosional differences between VD and BD. Each mechanism was altered by the presence of vegetation on VD and affected the other two through positive morphodynamic feedback.
First, we observed that the cross-shore excursion distance of the maximum wave run-up (Rmax) was over 10 times less variable for VD as compared to BD, during the first 11.3 hours (Fig. 2, A and B). For VD, the Rmax distance was nearly constant during this time, intercepting the dune at a cross-shore distance of 75 m (SD = 0.08 m). For BD, the Rmax distance ranged from 74 to 76 m (SD = 0.89 m). We also observed that the cross-shore excursion distance of the R2% wave run-up (R2% is the elevation that the largest 2% of all waves exceeded) was shorter for VD during this time, on average.
There was also more fine-scale variation in the VD slope at, and immediately offshore of, the Rmax distance relative to BD (Fig. 2, C and D). Heterogeneous and localized slope discontinuities on the dune surface with a grade greater than 30%, or “micro-slope” features, first appeared at the Rmax distance at 5.0 hours for VD. These first micro-slopes were colocated with mixed accretional-erosional hotspots, where individual run-up waves had removed sand from below R2% and then deposited it before reaching Rmax as they lost momentum and reached their cross-shore limit. By 11.3 hours, erosion seaward of both the Rmax and R2% lines began migrating shoreward and upslope as the storm progressed and the mean water level rose (as depicted by the lightening from dark blue to lighter blue colors, and eventually into micro-slopes, as depicted by the yellow colors). Micro-slopes were much less pronounced on BD, as the run-up and swash redistributed the sand over a broader range of the dune profile.
Second, the vegetation on VD (and its induced micro-slopes) concentrated the run-up water volume into a smaller volume of sand, which precipitated greater profile steepening and micro-slope instability (Fig. 3, A to C). At least initially, the consistently retarded run-up distances on VD kept the sand in the vegetated region of VD drier than that of BD, for the same cross-shore location. However, once the run-up passed this location and was retarded farther upslope, the water rapidly infiltrated and the volumetric water content increased on VD. In effect, the run-up water volume had been concentrated into a smaller volume of sand by the vegetation. Once the volumetric water content at the near surface began to exceed that at greater depths, the dune sands were increasingly poised for instability (see figs. S12 and S13).
Third, wave reflection was increased by the vegetation and its induced micro-slopes (Fig. 3, D to F). As soon as the waves intercepted the vegetated region of VD, at 4.0 hours, offshore wave reflection became greater on VD than on BD. Throughout the evolving storm conditions, the reflection was consistently 3% higher on VD (across the varying dune slope, wave height, and wave period combinations, as recorded by a range of Iribarren numbers, ξ = 0.37 to 0.44 among both VD and BD; linear regression fit for each as VD = 1.4x − 0.4, R2 = 0.42; BD = 1.3x − 0.3, R2 = 0.55).
Silva et al. (9) attributed a similar 4% increase in reflection to vegetation for ξ = 0.4, due to increased friction within the water column, but did not relate it to increased erosion. Reflection rapidly increased at 11.3 hours, as the micro-slopes accumulated and the scarp quickly steepened.
By 14.4 hours into the storm, a small and initial scarp 0.1 m in height was formed on VD (purple line at 76.5 m in Fig. 4A, and as also shown as the transition from bright green to yellow colors at ~76.5 m in Fig. 2C), and erosion accelerated as the beach-dune profile transitioned from a swash regime to a wave collision regime (Fig. 4, B to D). The dune was then undercut laterally, and the gravity-driven processes of scarp slumping began (13, 14), causing erosion in relatively large failure events. By this time frame, the eroded sediment had begun to accumulate into a ~6-m-wide underwater bar within the flume, with its peak ~28 m from the original dune toe. The waves were then more hindered by water depth limitations and impacted the profile with greater prior energy dissipation. This negative feedback loop of scarp slumping, nearshore bar growth, and decreased-intensity wave impact happened earlier on VD, potentially explaining how VD and BD became more similar toward the end of the experiment.
In our experiments, transition to the collision regime on VD began at 7.9 hours and there was a fully vertical scarp by 14.4 hours. In contrast, a wave swash regime existed on BD for much longer, with a transition to collision occurring at 15.5 hours and with a fully vertical scarp at 17.8 hours. In sum, the collision regime on VD persisted for a longer period of time than on BD (11.1 hours versus 3.5 hours, before the peak of the storm conditions), accounting for the greater cumulative erosion.
DISCUSSION
On the basis of the principal finding of this study, coastal engineers and managers may need to reexamine the predominant paradigm that dune vegetation reduces erosion during extreme events. As previous literature (including our own work) suggests, vegetation initially reduces the erosion caused by small waves over short time scales (minutes). However, as we show here, on planted and restored dunes, vegetation actually accelerates erosion over the course of an entire storm by inducing an earlier transition to a collision regime. In essence, dune vegetation disrupts the morphodynamic balance, tipping it toward the creation of micro-slopes and vertical instability.
Accordingly, engineers may need to further explore the assumptions that support models such as XBEACH (15) and CSHORE (16), which are used to design shoreline protection projects around the world (17). In these models, the vegetative roughness-induced friction and drag at fine spatiotemporal scales (e.g., 18–20) have been assumed to raise the water velocity threshold required for sediment mobilization to begin. While this effect reduces erosion to the aft of a plant, the broader concept is that vegetative structure can also induce scouring and supersaturation in front or to the side of the plants (21), creating spatially heterogeneous accretion and erosion patterns (5) and micro-slopes. To progress with these models, fine-scale physics and hydraulics must be better synchronized with the morphodynamic tipping points that delimit the erosional regimes of Sallenger (13)—without the assumption that vegetative structure always reduces erosion at coarser time scales.
Still, we contend that the value of planting vegetation for coastal protection can be gained in the years to decades before a single storm event—and this value is related to the ecological function of the plants rather than their biophysical structure alone (22). While sand can accumulate around any living or nonliving structure, native dune plants grow in size, replicate, and are stimulated by burial. Moreover, the linked ecogeomorphic process of succession acts at the landscape scale over longer time frames to control the shape of the dunes (23). The unique ecological function of living materials includes the ability to physiologically adapt to dynamic storm conditions, create spatially heterogeneous erosion and accretion patterns with a diverse array of plant species that fill several niches at the landscape scale, and continue to migrate landward and provide ecosystem services as the sea level rises globally—all of which help build the dunes. If vegetation is absent or unhealthy over the years before a storm, the dunes will be smaller when the storm hits and the damage to landward locations will be greater.
Historically, many coastal managers have assumed that the physiological aim of vegetation is to stabilize the sand during extreme events (24). Our results provide initial evidence that this assumption is incorrect, and we contend that the assumption has had negative consequences for coastal protection efforts. For example, after the 2004 Indian Ocean tsunami and the 2011 Tōhoku tsunami, nongovernmental organizations (NGOs) and government agencies planted nonnative Casuarina equisetifolia trees across large areas of the coast, believing that their structure will protect the coast during future extreme events. However, these policies ultimately increased erosion over longer time scales by replacing native plants, which led to less dune accretion and lower elevations (24). A similar story has played out with the use of various Ammophila, Spartina, Oenothera, and Tamarix species for stabilization projects around the world over the past century [e.g., (25)]. As shown here, an attempt to stabilize a dune based on a narrow view of vegetative structure will only accelerate its loss during an extreme storm event. Rather, coastal managers should select an appropriate species based on their ecological function to build the dunes in the years before the event occurs.
Although we tested the effect of only one species here, P. amarum, there is no reason to believe that the results would be qualitatively different given another species. Fundamentally, any living or nonliving structure that is placed onto the beach-dune profile will create a discontinuity in wave run-up and energy flow across the landscape. The same three mechanisms of enhanced erosion that we have discussed here will apply, and in fact are likely to be amplified in a case of an even greater plant coverage, biomass, or physical stature.
Moreover, as has been shown in the past by other dune studies, aboveground and belowground stems, stolons, and leaves function similarly under wave attack (5–6) and only fine roots hold onto the sediment in a unique manner (7). Thus, if anything, VD likely yielded an underestimate of the erosion caused by vegetation on the upper portions of real-world dunes covered by P. amarum (as VD was high in fine root biomass, yet low in other types of biomass, as compared to field conditions—see Materials and Methods). For real-world dunes, the key portion of the morphologic sequence that is most affected by vegetation is during the run-up regime and the initiation of scarp formation, which most typically occurs on the lower portions of the dunes where the vegetation densities are relatively lower. For these reasons, we expect that our findings are universalizable in a qualitative manner across all VD types, when they are subjected to extreme events over hours to days of time. We expect that only the absolute quantities of vegetation-induced erosion may differ as based on the specific species or planting densities.
Notably, our experiments did not continue beyond the peak of the simulated storm conditions. We can speculate, however, that the cumulative erosion differences should persist in time for real-world dunes, even after a storm, as the water level draws down and the interaction with vegetative structure ceases. We also note that the induced storm conditions were not designed to approximate a given spectrum of infragravity motion at dune toe, but rather to match the spectrum within the inner surf zone, based on a modeled dataset (figs. S1 and S2). However, wave transformation and reflection between these two positions in the bounded flume likely inserted somewhat similar motion, and the Rmax and R2% statistics appeared to be generally consistent with real-world datasets.
In summary, we found that the net effect of planted dune vegetation was to increase erosion during extreme events. Vegetation creates a physical barrier that shortens the length of maximum wave run-up, alters accretion and erosion patterns, and creates steep micro-slopes. Compared to bare dunes, vegetated dunes concentrate the same volume of water into a smaller volume of sand, which then predisposes the dune to fluidization and micro-slope formation, wave reflection, earlier scarp formation, and more rapid dune erosion over the course of a storm.
MEDIA CONTACT
Register for reporter access to contact detailsArticle Multimedia

Credit: Rusty A. Feagin et al. ,Does vegetation accelerate coastal dune erosion during extreme events?.Sci. Adv.9,eadg7135(2023).DOI:10.1126/sciadv.adg7135
Caption: (A) Vegetated dune (VD). (B) Bare dune (BD). The different camera angles reveal beach berm and dune apex features, but the initial profiles for VD and BD were equivalent throughout the 104-m length of the flume. (C) VD profile evolution. (D) BD profile evolution. Initial profiles were equivalent at time zero as denoted by dotted lines (shown here only within the vegetated region from 72.5 to 80 m in cross-shore position). Colored lines depict the profiles at the end of the numbered time intervals. (E) Erosion during specified time intervals (bars) and cumulative erosion (lines). (F) Timeline (continuous) of major events in BD versus VD profile evolution. 2,3Refer to Figs. 2 and 3 for details.

Credit: Rusty A. Feagin et al. ,Does vegetation accelerate coastal dune erosion during extreme events?.Sci. Adv.9,eadg7135(2023).DOI:10.1126/sciadv.adg7135
Caption: (A) VD maximum run-up distance (Rmax), R2% run-up distance, and accretion-erosion patterns over the course of the storm. (B) BD Rmax distance, R2% distance, and accretion-erosion patterns. (C) VD micro-slopes over the course of the storm. (D) BD micro-slopes over the course of the storm. In (D), the white space around 10 and 11.5 hours on the y axis indicates data gaps. Axes for all graphics: The x axis ranges from the time that waves first encountered the vegetation (at 4 hours) until the peak of the storm conditions. The y axis ranges from the cross-shore location where the vegetation began at the dune toe (72.5 m) and extended landward to the dune peak (80 m).

Credit: Rusty A. Feagin et al. ,Does vegetation accelerate coastal dune erosion during extreme events?.Sci. Adv.9,eadg7135(2023).DOI:10.1126/sciadv.adg7135
Caption: (A) Erosion and accretion at the R2% line at 4.8, 7.9, 11.3, and 14.4 hours into the storm. The x axis for each subgraphic is the cross-shore distance from the R2% line, and the y axis is the summed change per time period. (B and C) Excess volumetric water content across time, near surface at 73 m, and at 75 m in the cross-shore direction, respectively. The x axis is continuous time in hours. Positive values on the y axis refer to near-surface volumetric water content exceeding that at depth, negative values vice versa. (D) Wave reflection across time highlighting the apparent transition at 11.3 hours on VD. (E) Wave reflection for VD and BD as a function of the Iribarren number; VD = 1.4x − 0.4, R2 = 0.42, blue circles; BD = 1.3x − 0.3, R2 = 0.55, black crosses. (F) The vegetation retarded wave run-up and concentrated water volume, supersaturating the sand and promoting instability.

Credit: Rusty A. Feagin et al. ,Does vegetation accelerate coastal dune erosion during extreme events?.Sci. Adv.9,eadg7135(2023).DOI:10.1126/sciadv.adg7135
Caption: (A) An example of Terrestrial Laser Scanning (TLS) data for the VD profile, viewed from the cross-shore dimension (i.e., the side), at 0, 12.3, 12.8, 13.5, and 14.4 hours into the storm conditions. The red points depict both the vegetation and the sediment surface before the experiment began at 0 hours. The other colors depict the sediment surface only, between 12.3 and 14.4 hours. By 14.4. hours, an initial 0.1-m tall scarp was apparent at ~76.5 m. (B) P. amarum plants on VD before the experiment began at 0 hours. Drip line (black hose) was removed during experimentation. (C) Run-up intercepting plants on VD at 11.3 hours. The depicted sensor array included an optical sediment gauge, sediment movement sensor, ultrasonic sensor, and acoustic velocimeter. (D) A 0.79-m tall scarp on VD at 18.4 hours.