
Polar Bear Collar Cam B-Roll 2014, 2015, 2016
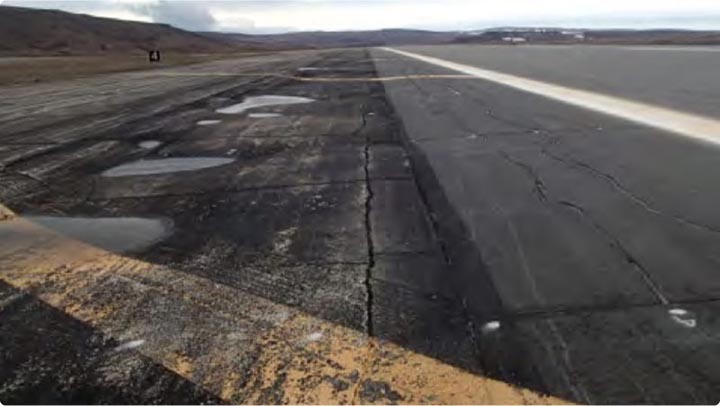
Cracks and depressions formed on a runway and shoulder caused by water thawing and refreezing, Pituffik Space Base, Greenland.
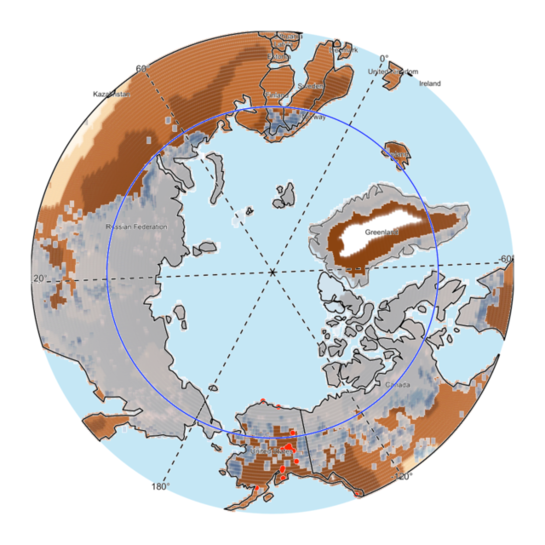
To aid military decision-makers who need climate-informed tools to assess risks and support long-term planning in a changing Arctic, APL researchers developed a tool that shows current U.S. bases (red) and forecasts permafrost thickness (grays, in kilograms per square meter) and monthly mean near-surface relative humidity (browns, in percent) every September from 2006 to 2095. Darker colors represent higher values.
Newswise — When the Danish bulk carrier Nordic Orion set sail on Sept. 17, 2013, from Vancouver, British Columbia, on a journey to Finland, it set a course for a groundbreaking journey. Rather than turn south to pass through the Panama Canal, it headed north to traverse the Northwest Passage, a winding sea route through the archipelago off Canada’s north and east coasts.
Typically locked in ice and still riddled with navigational and territorial issues, the Northwest Passage became nearly ice-free in August 2007, the first time since records have been kept.
Click here for Interactive Features
The passage is the shortest and cheapest route from East Asia to North America’s east coast, bypassing the tolls and shallower waters of the Panama Canal, making it a tempting route for shipping vessels.
With support from the Canadian government, which provided a Canadian Coast Guard icebreaker to escort the 740-foot (215-meter) ship through the insular maze, the Nordic Orion took its chances, and it paid off.
The ship became the first large carrier to traverse the passage, cutting off nearly 1,200 miles (1,930 kilometers) — an estimated four days — of travel and saving an estimated $200,000, including $80,000 in fuel costs.
The successful passage was a harbinger of things to come. Previously accessible only to the most fortified ships and plucky adventurers, the melting Arctic opens a whole new world not only to military warships trying to traverse the region but to recreational boaters, fishers, drilling companies, cargo ships and cruise vessels as well.
For companies, the Arctic seabed is suspected to hold billions of dollars in raw goods, including 13% of the world’s undiscovered oil, 30% of undiscovered natural gas, and the world’s largest deposits of nickel, coal and zinc.
For fishers, warming Arctic waters have kicked off a year-round community takeover by fish from farther south, a shift rooted in both the warming temperatures that Atlantic fish can tolerate and increased phytoplankton that the migrant populations can feed on. Researchers monitoring arctic fish stocks found that commercially important species like Atlantic cod and haddock in the Barents Sea off the northern coasts of Norway and Russia moved nearly 100 miles (160 kilometers) northward from 2004 to 2012. Meanwhile, native arctic fishes, such as Greenland halibut and bigeye sculpin, moved farther poleward and deeper into the water column, supposedly to escape the new competition.
Having more ship traffic (and people) in the Arctic raises the chances that one or many could be caught unprepared during the months that ice pack forms and melts. Mary Keller is keenly aware of that impending risk.
“In many ways, sea ice is a brave new world,” she said. “The ice is thinning, and precipitation is changing from snow to rain. Both will accelerate the seasonal spring/summer sea ice melt, which begins, on average, about a week earlier every decade. Currents and winds will set that ice in motion, so areas that appear clear in satellite imagery can be ice-blocked just a day or two later, spelling trouble for ships that thought they were on a safe course through a strait or bay.”
Ships will need near-term sea ice forecasts to ensure they can safely pass through the region, but according to Keller, what is currently available is not up to the challenge.
“It’s as inaccurate as weather forecasting had been in, say, the 1970s,” she said.
Ice-tracking methods at the National Ice Center today rely on an intensive process involving analysts manually clicking tens of thousands of points along the ice edge in satellite images. They then incorporate the longitude and latitude coordinates of the points into a geographical information system to create maps they can deliver to interested parties.
The Ice Center is producing daily 48-hour forecast maps for certain regions of the Arctic, but the resolutions are still too low to route ships.
Keller and her colleague Christine Piatko, a computer scientist at APL, had the nascent idea to somehow leverage the capabilities of machine learning and artificial intelligence to improve the forecasting capabilities, but exactly how was at first hazy.
Much in the same way companies like Microsoft have leveraged photos and artificial intelligence (AI) to analyze animal movements and help combat mass extinction, Piatko’s idea was to leverage tracking data of animals that depend on sea ice, such as polar bears and walruses, to predict where the ice will be. And there was plenty of data to work with.
For nearly 30 years, scientists have equipped various animals with trackers to show how their movements and migrations are each individually shifting with the changing climate.
Piatko and her team found tracking data for walruses, caribou, ringed seals, Arctic hares, Arctic foxes, numerous sea birds and even Dall sheep. By far the most complete data, obtained from nearly 300 polar bears, was collected from 1985 to 2016 in the Beaufort Sea. It included the U.S. Geological Survey’s (USGS) GPS-enabled video camera collar data, which offered not only a glimpse into the bears’ movements but a chance to virtually hunt, sleep and swim with the world’s largest terrestrial carnivores.
Analyzing the bears’ paths and laying them over sea ice data, the team was able to clearly see that before 2000, polar bears hunting in the Beaufort Sea concentrated in areas that, today, are ice-free and no longer accessible to them. The animals subsequently moved eastward into regions that still retained thick ice in the years after.
“It was interesting from a biological perspective and probably quite useful for understanding migration trends,” Piatko said. “But for our purposes, it was just too patchy and coarse.” Many of the animals’ paths were localized and difficult to analyze. And given that the data also spanned years, the resolution wouldn’t be much better than what ice prediction modeling already does. They needed to be able to predict in the order of days or, at most, weeks.
Setting the polar bear effort aside, Piatko and Keller started instead working to create a machine-learning model that could do exactly what they needed: generate high-resolution daily sea ice forecasts out to seven days.
They trained the AI using data and forecasts from various atmospheric and oceanographic models of the Beaufort Sea, including ocean currents, sea surface temperature, winds and sea ice extent during the freeze-up period from September to November in 2016 and 2018-2020.
The system proved strikingly accurate. Compared with real-world sea ice data, the team’s model predicted ice extent with 97% and 93% accuracy at one and seven days out, respectively.
In one highlighted example from Oct. 24 to Oct. 26, 2019, the model predicted the closure of sea ice above Canada’s Northwest Territories within one day of when it occurred. Because the model showed the potential for ice formation on the correct date, Keller and Piatko’s team said it would have provided sufficient information for any ship to pass through safely.
The model’s initial success spurred a follow-on project — from ideas born out of Walrus — to ensure the model is grounded in real-world physics, which Piatko and Keller said was not guaranteed in the original design. “There currently is no built-in knowledge to say what it’s doing is physically sensible,” Piatko said.
Heather Hunter, a senior research scientist at APL with expertise in applications of computer vision and machine learning to remote sensing, spearheads the project. She and her team are using a physics-informed neural network, or PINN, a relatively new (and theoretically faster) type of deep learning framework. It incorporates the quite complex physics equations believed to control the interrelationships of a system’s various parts.
Hunter said that such models are notoriously difficult to train and unstable because they’re essentially creating a solution from a bunch of noise. “That’s difficult, even giving it support data to help it come to a solution,” she said. “That would be difficult to even ask a person to do.”
Given the complexity of the system, Hunter’s group is starting small. They’re trying to forecast just sea ice movement in the Greenland Sea, where the East Greenland Current strongly forces ice drift. And even that has proven challenging.
“Using PINNs for a remote sensing problem like this is kind of new, and I think a lot of the reason for that is because people don’t typically use them to make predictions over large areas and long time spans like we’re doing,’” Hunter said. “A lot of the PINNs work I see is at finer scales — on the order of seconds to hours, and from the nanoscale up to a few meters.”
Even so, the team has already gotten the model to start working. In its latest phase, the network will accurately spit out a one-day forecast of which direction sea ice in the Greenland Sea will move, marking a huge feat in its development already. The trouble has been getting it to accurately predict how far the ice will move and how complex that movement will be. That’s something Hunter suspects has to do with simplifications they had to make to the underlying physics equations. “PINNs seem to be sensitive to how complex — or simple — those are,” she said.
Now in its second year of model development, the group is trying to eliminate those simplifications while also pushing the model one step further: making it so it predicts not only sea ice movement but also sea ice deformation, a characteristic essential to knowing where openings in the ice will form.
“These openings, called leads, are usually big enough to allow ships to pass through, though they can quickly close overnight and trap those same ships,” Hunter said. “They also absorb a lot of heat from the Sun, which accelerates ice melt, so knowing where these leads form is important from both a climate science and operational perspective.”
Beyond projecting large-scale changes to sea ice for ships, there’s another need for localized resolution that can help personnel navigate the melting environment in vehicles and on foot.
“Fact of the matter is, the ice is melting faster than it’s being created, and it’s cracking unpredictably,” said Jackie Sharp, who was co-principal investigator with Kelles Gordge on a project at APL called Detecting Ice Variations Over Time (DIVOT). “Satellites deliver great images and data of what’s happening to ice patterns at large-scale effects, but we want to deliver something that can be body-worn and let an operator know in real time where they should be safely driving or walking, sort of like Waze for ice.”
Sharp and Gordge quickly learned there wasn’t much relevant data available in terms of localized ice fracture imagery, so their team took matters into its own hands. The group started freezing massive blocks of ice around APL and creating synthetic ice fractures by applying heat and, well, brute force. “We were literally stabbing it with ice picks,” Sharp said.
Using spectrometers, infrared cameras, and hyperspectral imaging to capture the jags and features of ice cracks, the team developed an algorithm that could autonomously recognize the ice fissures. The initial progress on DIVOT proved promising, having confirmed that it’s possible to detect ice defects using body-worn cameras and that large, surface cracks were easy to spot. But Sharp and Gordge would like to take the project a step further and deliver a more holistic view.
“We’d love to develop some sort of augmented reality [AR] deliverable, maybe it’s glasses and the operator can see where hot spots are on the ground,” Sharp said. They’ve made attempts to bring the pieces together to make AR an actual reality.
Team members froze large ice blocks at APL and then pressed their fingers onto the surface to warm a few spots. Using open-source AR tools connected to a computer camera, they could clearly see the warm red dots where their fingers had touched the ice and transferred a bit of heat.
It was a start, but Sharp notes there’s still a ways to go before seeing a tool like this deployed in the field.
“Even if it’s not deployed directly on a body, we know this observation method could prove viable to observe how ice structures are failing over time or to see if someone was in a certain area and left a heat signature,” Sharp said. “We can start applying machine learning to these sorts of problems.”
Much of America’s Arctic territory, however, lies on land in Alaska. Along its more than 34,000 miles (54,700 kilometers) of coastline — the longest in the United States — the U.S. military has just 49 National Guard posts and five military bases. A sixth (the Pituffik Space Base, formerly called the Thule Air Base) sits in Greenland. There are no Navy ports.
The Department of Defense is pouring billions of dollars into building infrastructure across the Arctic to enable military operations in the region. But deciding where to put new infrastructure and how to preserve what’s already there is complex.
Plans and models up until now have considered the Arctic as it has been known, but it will obviously be very different in the not-too-distant future (if not even now).
Melting permafrost, the foundation of many structures throughout Alaska, and water-freeze are already plaguing the existing military bases. A 2022 report from the Defense Department’s Office of Inspector General identified several examples where the climate has already taken its toll: a crumbling runway at the Pituffik Space Base, substantial storm damage at the Eareckson Air Station and collapsing bunkers at Eielson Air Force Base.
Matters will likely get worse. Even under the best climate scenarios, scientific models project that the global area with sustainable permafrost will drop from its 2020 value by roughly 16% by 2050, from around 5.6 million square miles (9 million square kilometers) to 4.7 million square miles (7.6 million square kilometers) — a loss of nearly twice the area of Alaska.
Aware of the impending challenge, Piatko and Lauren Ice started a separate project called Climate-informed Arctic Future Picture (CARP). The idea was to develop a flexible and adaptable tool to help U.S. defense decision-makers visualize the changing landscape of the Arctic decades into the future as they assess risk and plan future operations in the region.
“It looks at personnel and equipment readiness as well as infrastructure resilience in a changing Arctic environment,” Ice explained.
Their design takes the outputs of the most recent Arctic climate model predictions, including permafrost melt, temperature extremes, wind, humidity and flooding, and feeds those into a geospatial tool that includes military infrastructure, such as bases, buildings and transportation infrastructure.
The resulting model characterizes the Arctic landscape for the next 70 years, out to 2095, and can be viewed at local, regional and global scales of the Arctic. And it’s modular and adaptable enough to incorporate updated data and models.
It ultimately showed a classic cost-benefit: The average temperatures in Alaska will likely become milder and more amenable to humans and equipment. The cost is that flooding and permafrost melt will become the greatest natural threats to military bases. In one trial case looking at the operating environment in January, minimum temperatures from 2023 to 2050 increased by nearly 25 F (minus 4 C) in interior Alaska, from minus 15 F to 3 F (minus 26 C to minus 16 C) near Fairbanks and Eielson Air Force Base.
Of course, the model still requires some tweaks. Not all necessary data was readily available, Piatko noted, and some had poor spatial or temporal resolutions, items they’d address over time.
But even if the specific changes weren’t exact yet, the general trends were clear. The Arctic today is literally melting away, and the consequences will touch everything, from the environment and wildlife to the global economy and political relations.
“I’ve been told many times that the Arctic is changing four times as fast as the rest of the world, but it was still shocking to see the scale of that temperature increase to the point that I think it could change how we operate up there,” Ice said. “Of course, you’re going to have cold extremes, where the Arctic will still reach severely cold temperatures. But the fact is that the average minimum temperature is going to substantially increase, and that says a lot for how we need to prepare for operations 20, 30 years down the road.”
While the sheer number of diverse and sometimes opposing challenges from the melting Arctic can be daunting, Marisa Hughes, a mathematician and assistant program manager for Environmental Resilience in APL’s Research and Exploratory Development Mission Area, remains optimistic.
“At APL, we bring emerging research and creative solutions to critical challenges like Arctic operations,” Hughes said. “It’s part of our broader response to climate change, where we are providing climate intelligence and ensuring operational resilience.”
For her, the breadth of possible solutions to the Arctic’s challenges keeps growing, with new approaches emerging continuously in the various fields: sensing, modeling, machine learning, materials science, biology and resilient systems design. And with collaborations increasingly happening among these various fields, novel solutions have already emerged.
“Yes, the Arctic continues to change at an accelerated rate, but so does technology,” Hughes said. “I work primarily in artificial intelligence, and think how much that field has changed in just the last decade! There’s reason for us to remain positive that we will have the means to meet the challenges head on and protect the Arctic, our people and our nation. We can do it. We must do it.”
MEDIA CONTACT
Register for reporter access to contact detailsArticle Multimedia
Credit:
Caption: Cracks and depressions formed on a runway and shoulder caused by water thawing and refreezing, Pituffik Space Base, Greenland.
Credit:
Caption: To aid military decision-makers who need climate-informed tools to assess risks and support long-term planning in a changing Arctic, APL researchers developed a tool that shows current U.S. bases (red) and forecasts permafrost thickness (grays, in kilograms per square meter) and monthly mean near-surface relative humidity (browns, in percent) every September from 2006 to 2095. Darker colors represent higher values.