Global Temperature Report: March 2022
Global climate trend since Dec. 1 1978: +0.13 C per decade
March Temperatures (preliminary)
Global composite temp.: +0.15 C (+0.27°F) equal to seasonal average
Northern Hemisphere: +0.27 C (+0.49 °F) above seasonal average
Southern Hemisphere: +0.02 C (+0.04 °F) below seasonal average
Tropics: -0.08 C (-0.14 °F) below seasonal average
February Temperatures (final)
Global composite temp.: -0.01 C (-0.02°F) equal to seasonal average
Northern Hemisphere: +0.01 C (+0.02 °F) above seasonal average
Southern Hemisphere: -0.02 C (-0.04 °F) below seasonal average
Tropics: -0.24 C (-0.43 °F) below seasonal average
Notes on data released April 2, 2022 (v6.0, with 1991-2020 reference base)
Note for March Report: These text reports have been delayed due to the extra duties Christy has acquired since June 2021 as interim VP for Research and Economic Development – an operation of $125M/yr and 1,100 employees. This adds to his current duties as Director of the Earth System Science Center, Professor, and State Climatologist. He will be relinquishing the duties of VP on 1 Aug 2022. Please note that Spencer and Christy generate and provide these data on a volunteer-basis as federal funding was terminated a few years ago.
The global temperature departure from average in March warmed to +0.15 °C (+0.27°F). The main warming shift occurred in the Northern Hemisphere as the area warmed by +0.26 °C (+0.47 °F) from February. This may be the beginning of the return to warmer temperatures as the La Niña typically declines in influence during the NH spring. However, latest values of various El Niño/La Niña indices indicate the La Niña may survive for several more months. Indeed, the sea surface temperatures of the key region “Niño 3.4” have remained below average through April.
The latest on the evolution of La Niña and its anticipated diminishment is provided by NOAA here:
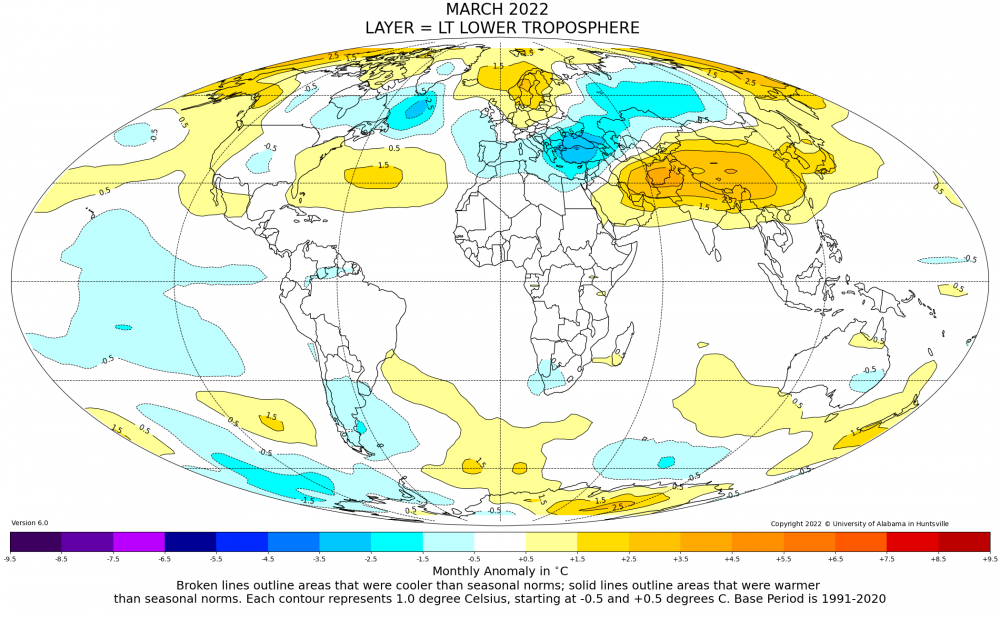
The planet’s warmest region, in terms of the monthly departure from average, was over the rural area of Kulesabza in Afghanistan where one grid cell hit +4.1 °C (+7.4 °F) above normal. This region anchored a broad warmer-than-average area from Saudi Arabia to Japan. Other warm areas were experienced in Scandinavia, Alaska/eastern Russia, central No. Atlantic, and eastern Antarctica. Reports of tremendous surface temperature values (> 38°C above average) during a brief mid-March heat wave in East Antarctica did not have much influence on the deep layer of the atmosphere as monthly anomalies in this area are typically even greater than the warmest patch of +2.5 °C reported this month.
As so often happens, when one region is hot due to a stagnant weather pattern, an adjacent region is cold as a result of the same pattern. In this case the coolest departure from average occurred in Northern Turkey near the village of Kuzhaka at -3.6 °C (-6.5 °F). This was in the center of a broad region of cool temperature from Europe to central Russia. It was cooler than average too over the tropical Pacific (La Niña), over the far North Atlantic and the far South Pacific.
The large-scale pattern this month favored cool temperature over the central conterminous US and warmth along both coasts (as in February). On average, the 48-state temperature came out a bit above the normal at +0.21 °C (+0.38 °F). Alaska was a quite a bit warmer than usual overall, pushing the 49-state average to +0.41 °C (+0.74 °F). [We don’t include Hawaii in the US results because its land area is less than that of a satellite grid square, so it would have virtually no impact on the overall national results.]
New Reference Base Jan 2021 and forward. As noted in the Jan 2021 GTR, the situation comes around every 10 years when the reference period or “30-year normal” that we use to calculate the departures is redefined. With that, we have averaged the absolute temperatures over the period 1991-2020, in accordance with the World Meteorological Organization’s guidelines, and use this as the new base period. This allows the anomalies to relate more closely to the experience of the average person, i.e. the climate of the last 30 years. Due to the rising trend of global and regional temperatures, the new normals are a little warmer than before, i.e. the global average temperature for Januaries for 1991-2020 is 0.14 °C warmer than the average for Januaries during 1981-2010. So, the new departures from this now warmer average will appear to be cooler, but this is an artifact of simply applying a new base period. It is important to remember that changes over time periods, such as a trend value or the relative difference of one year to the next, will not change. Think about it this way, all we’ve done is to take the entire time series and shifted it down a little.
To-Do List: There has been a delay in our ability to utilize and merge the new generation of microwave sensors (ATMS) on the NPP and JPSS satellites. As of now, the calibration equations applied by the agency have changed at least twice, so that the data stream contains inhomogeneities which obviously impact the type of measurements we seek. We are hoping this is resolved soon with a dataset that is built with a single, consistent set of calibration equations. In addition, the current non-drifting satellite operated by the Europeans, MetOP-B, has not yet been adjusted or “neutralized” for its seasonal peculiarities related to its unique equatorial crossing time (0930). While these MetOP-B peculiarities do not affect the long-term global trend, they do introduce error within a particular year in specific locations over land.
As part of an ongoing joint project between UAH, NOAA and NASA, Christy and Dr. Roy Spencer, an ESSC principal scientist, use data gathered by advanced microwave sounding units on NOAA, NASA and European satellites to produce temperature readings for almost all regions of the Earth. This includes remote desert, ocean and rain forest areas where reliable climate data are not otherwise available. Drs. Danny Braswell and Rob Junod assist in the preparation of these reports.
The satellite-based instruments measure the temperature of the atmosphere from the surface up to an altitude of about eight kilometers above sea level. Once the monthly temperature data are collected and processed, they are placed in a "public" computer file for immediate access by atmospheric sciThe complete version 6 lower troposphere dataset is available here:
http://www.nsstc.uah.edu/data/msu/v6.0/tlt/uahncdc_lt_6.0.txt
Archived color maps of local temperature anomalies are available on-line a
http://nsstc.uah.edu/climate/
Neither Christy nor Spencer receives any research support or funding from oil, coal or industrial companies or organizations, or from any private or special interest groups. All of their climate research funding comes from federal and state grants or contracts.